It the first two parts of this blog series, we covered some underlying technical code - first on base32 encoding and then in part-two we covered TOTP for one-time use password generation. We also created some DUnit tests for the code as we went along. This series will attempt to cover the full development lifecycle of a Google Authenticator style app written in Delphi and as such, we will cover some useful tools and techniques for product development.
In this article, I want to bolster the project’s unit tests with the additional of an extremely cool tool that should be in every Delphi developer’s toolbox and that is TestInsight, a free tool from the world-renowned Delphi genius, Stefan Glienke. He is a highly respected Delphi MVP and was acknowledged by Embarcadero as MVP of the year in 2015.
TestInsight Installation and Configuration
The first thing you will need to do is to download the installer from the TestInsight wiki page. (The latest version as of today for RADStudio 11 is 1.2.0.1 can be found at this direct link: https://files.spring4d.com/TestInsight/1.2.0.1/TestInsightSetup.zip) Download and extract this zip file and then run the TestInsightSetup.exe installer.
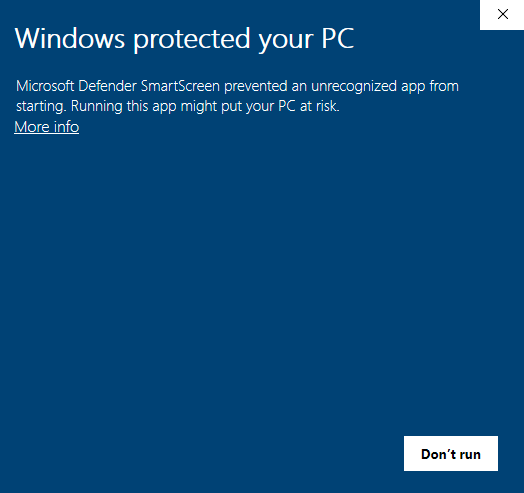
Note that the overly-sensitive Microsoft Defender Smartscreen service in Windows 10 may warn you that this is an unrecognized app. Click on the More info link and then click the Run anyway button to continue with the setup process.
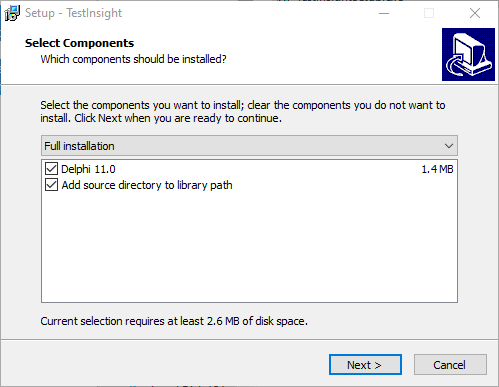
After the setup process continues, and you confirm the User Account Control warning, the setup wizard presents a list of detected Delphi versions on your system and gives you an option to edit the source path. Accept the defaults (or tweak as you desire) and click on the Next button for the next configuration option.
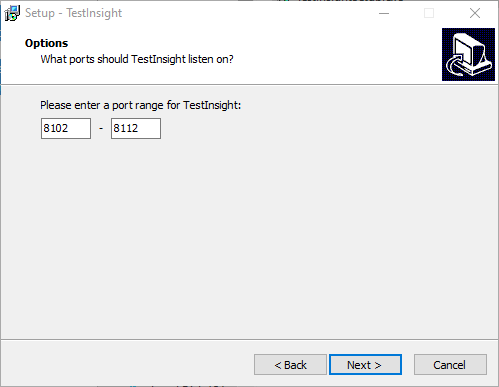
You will then be presented with a port range to use for the IDE Expert to communicate with itself. The client piece that is embedded in your test application talks to the IDE Expert installed into the RAD Studio IDE that is listening for incoming TCP connections within this port range. The defaults should be sufficient for most users (using a range of ports allows multiple copies of the RAD Studio IDE to be running TestInsight using their own port numbers.) Click the Next button to start the install.
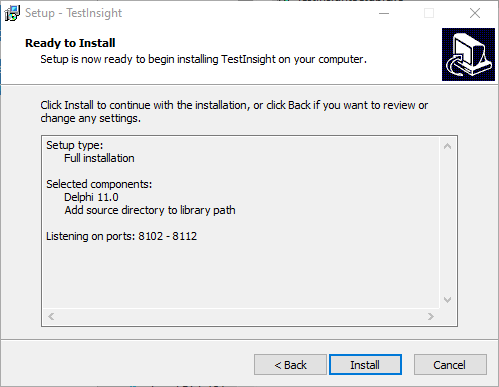
Those two configuration screens are all that is needed to be completed before starting the installation process. Click the Install button to continue.
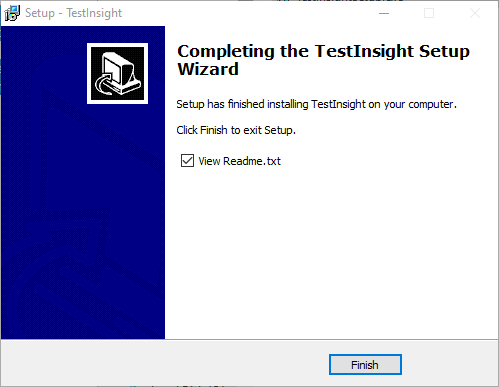
The install process typically takes a few seconds and then you are presented with the last screen of the install wizard, with the option to view the included Readme.txt file in your default note editor. Click on the Finish button to close the install wizard.
For reference, this is the current contents of the Readme.txt file:
1
2
3
4
5
6
7
8
9
10
11
12
13
14
TestInsight 1.2.0.1
Copyright (c) 2014-2021 Stefan Glienke - All rights reserved

Please report issues on http://bitbucket.org/sglienke/testinsight/issues

HOW TO GET STARTED:

After installation you can access TestInsight in the IDE by selecting View->TestInsight Explorer.

In order to make TestInsight work with your project it needs to have the TESTINSIGHT compiler directive
defined in the project. You can do that quickly with the context menu in the project manager.

In your application you need to use the TestInsight. unit for the framework you are using.
Just call the RunRegisteredTests routine or manually register the Listener/Logger to your test framework.
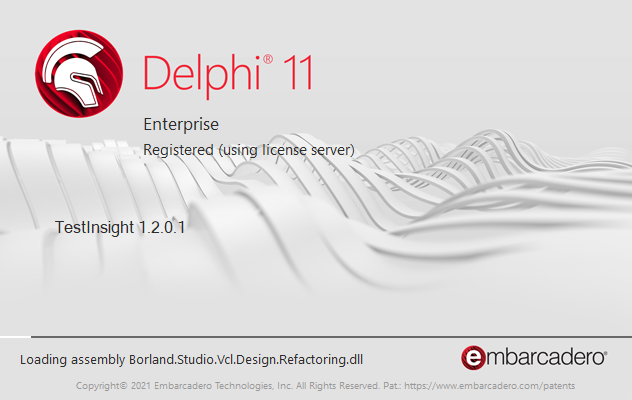
The next time you launch RAD Studio, you should see TestInsight listed in the Splash Screen while the IDE loads, as seen below:
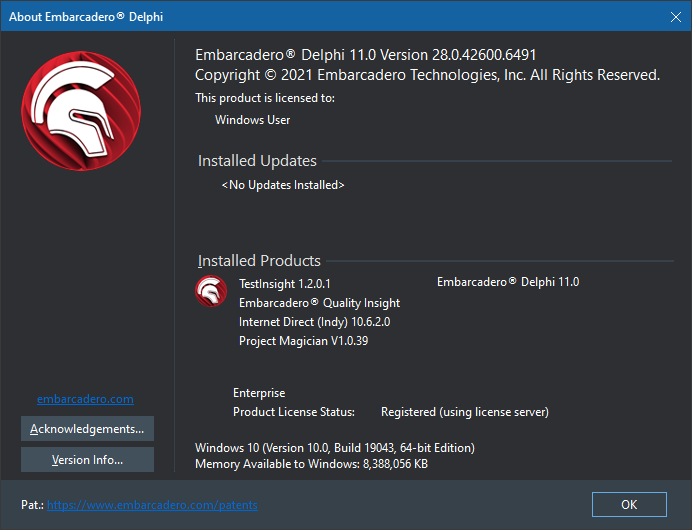
There are multiple more places that TestInsight appears in your IDE. When clicking on Help and then About, you should see a line for TestInsight and its installed version number listed among the other items in the “Installed Products” list as seen below:
If you need to change the configured behavior of the TestInsight IDE Expert, you can use the Tools menu to access the Options… page to view a new configuration option available within the Third Party section as seen below.
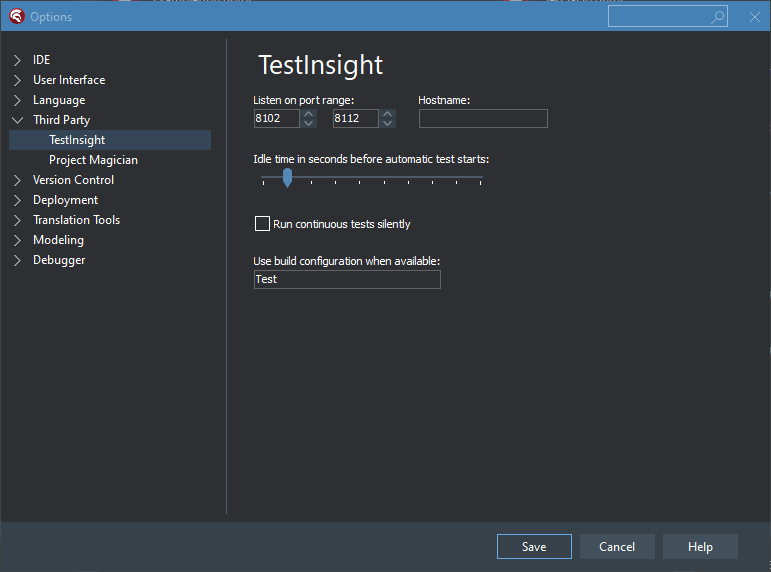
There are a few system settings available here. For example, you can update the Port Range that you entered during the setup process on this screen. The TestInsight listener can also be bound to a specific Hostname if desired (useful for multi-homed hosts with potential port conflicts.) There are options for customizing the behavior of the automatic running of tests. The idle time in seconds trackbar is set to 2 seconds by default and each trackbar tick is one second. The ‘Run continuous tests silently’ option runs the tests and passes SW_HIDE to the ShellExecuteAndWait method preventing the runner from displaying. If you have multiple build configurations setup on your test project, you can ask TestInsight to use the one named ‘Test’ by default. You can override that build configuration name here. For most developers, the TestInsight settings should work without modification.
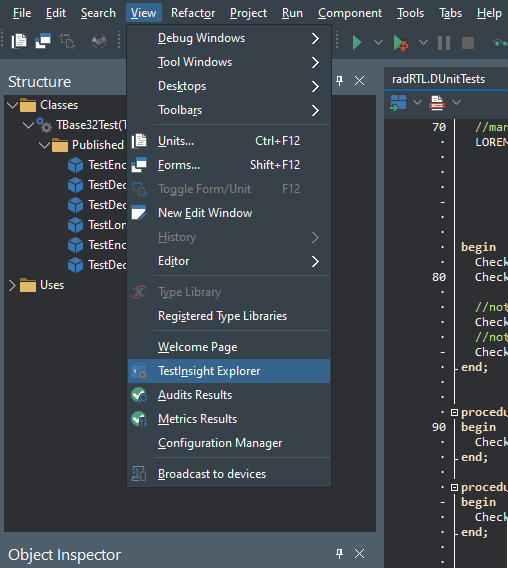
Another IDE enhancement is a new TestInsight Explorer menu option available in the View menu as you can see below. You will want to display this dockable window when you are editing a project (or a project group with one test project) that contains your unit tests.
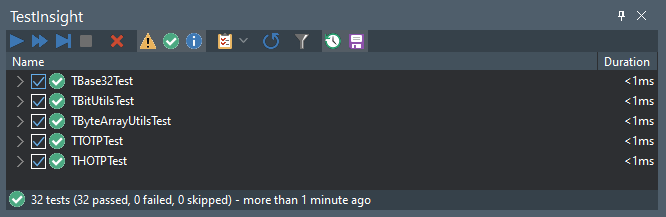
The super-cool TestInsight Explorer window is displayed below. It is elegantly simple, and yet powerful. This can be a floating window, or you can dock it in the IDE where you like. For me, it makes sense to dock this at the bottom of the editor as I am used to looking for the Messages window in this same location. (Tip: dock this window and save its location by saving the Desktop settings so you will always see the TestInsight Explorer automatically in the same location.)
Configuring Your Unit Test Projects
Technically, you can integrate TestInsight with any project but the most convenient way is to combine TestInsight with your existing DUnit, DUnit2, or DUnitX test project. Runners are included for these test suites and you simply change your plumbing in your DPR to use the appropriate TestInsight runner unit and call RunRegisteredTests which you are likely already doing.
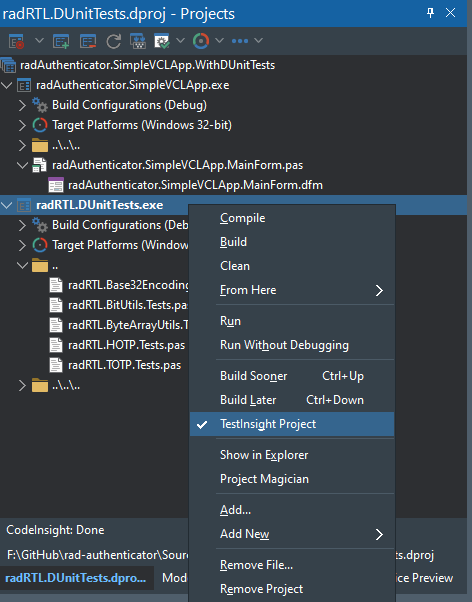
You can very easily update your test projects to work with TestInsight with just a little effort. But it is even easier if you use the built in Project Explorer enhancement. Bring up an existing Unit Test project and right click it in the Project Explorer and select the new TestInsight Project option. This will automatically add a new conditional define called TESTINSIGHT to your project. If you click it again to toggle this option, and it will automatically remove the TESTINSIGHT define if found. (Note: you will still need to make changes to the Uses clause to utilize the correct TestInsight runner for new DUnit projects. DUnitX projects include the TESTINSIGHT define check by default so you should not have to make any runner changes for DUnitXt.)
Key point: once the TestInsight IDE Expert is communicating with a TestInsight configured project, feedback will be posted back to the TestInsight Explorer window while a test suite is executed using a simple REST API.
Run TestInsight
To see this in action, you can clone the RADAuthenticator repository from GitHub and open the radRTL.DUnitTests.dproj file found in the Source\Tests\DUnit\Project folder. (Or, simply open one of your own test projects and enable it for TestInsight.)
Once you have a unit test project open, you can simply hit F9 to run the project and the results should be displayed within the TestInsight Explorer window. One of the coolest features is the feature to ‘Run tests when project is saved’ which is enabled by clicking the disk icon in the TestInsight toolbar. When that is enabled, simply hit CTRL-S (or File->Save) and the tests will automatically run. This is the quickest way to get feedback from your unit test changes in Delphi! In the next section we will cover the various options available to customize how TestInsight works. It is a truly amazing tool that greatly enhances your unit testing capabilities within the IDE with little to no changes to how you work today.
Diagnosing Problems
If you have any problems there is a FAQ page available on the TestInsight wiki. You can also try to diagnose the issue yourself. With the RAD Studio IDE open and TestInsight IDE Expert installed, you can verify communication with the TestInsight IDE Expert by making a web call in your browser. Using the default installation options you should be able to make a connection using http://localhost:8102/tests and you should get a JSON response containing any selected tests in the current TestInsight project. If you have a TestInsight enabled unit test project open in the IDE then the result of that web call should contain a list of all tests listed in the TestInsight Explorer window which are currently selected.
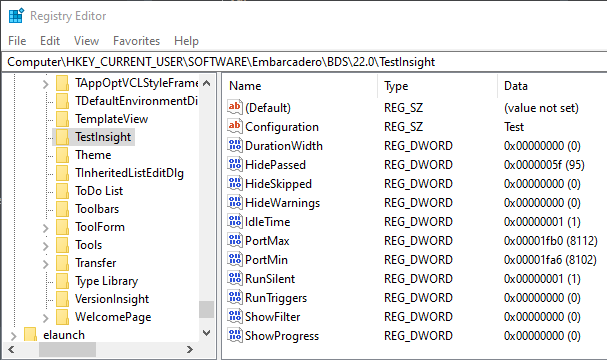
TestInsight settings are found in the registry. For RAD Studio 11 the registry base key is HKCU\Software\Embarcadero\BDS\22.0. There is a ‘TestInsight’ key located here with all of the available settings as shown below.
When you run a TestInsight enabled unit test project a TestInsightSettings.ini configuration file is saved in the same output file location. This file contains the BaseUrl for the test application to use for connecting back to the TestInsight IDE expert. Copy the BaseUrl setting from this file and paste it into your browser and it should make a connection to the TestInsight IDE expert.
Probably the most common question is how to keep the TestInsight Explorer window docked where you last put it. This window is just like any other RAD Studio IDE dockable window and the position can be saved with a IDE ‘desktop’ setting. Simply arrange your windows to your liking and then use the IDE menu option (View->Desktops) to save your desktop settings and your TestInsight Explorer window will be restored to your preferred location just like every other dockable window.
“Is TestInsight open source” is probably second most common question asked. Stefan has repeatedly stated this is not an open source project but it is free to use. I was pleasantly surprised to see that Stefan included the source to the unit testing integrations and the main TestInsight client piece. (The main source missing is for the IDE integration work.) There is a Source folder where the TestInsight###.dll is installed (where ### is the lib suffix designating the RAD Studio package version number, which is 280 for RAD Studio 11.) You should find TestInsight source units for Client, DUnit, DUni2, and DUnitX. On my system the home folder for TestInsight can be found in a subdirectory of the users folder (AppData\Local\Programs\TestInsight)
Using The TestInsight Explorer
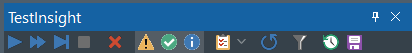
If you have been running Unit Tests within the IDE for a while you may not grasp how cool the TestInsight Explorer window is right away. Let us quickly go over all the functionality of this new dockable tool window by starting with the first three Run icons.
You can start out simply clicking the first Run icon in the TestInsight Explorer window which Runs all tests and you should see the TestInsight Explorer window updated with the result of the testsuite execution (# of tests passed/failed/skipped and how long it took.) This ‘Run all tests’ functionality seems pretty standard but you can get a little more involved by checking boxes next to individuals tests that you want to run in order to filter the results (similar to what you can do in the DUnit GUI window.)
The next icon, the FastForward toolbar button, behaves differently if there are tests selected or not. If there are no tests selected, then this is used to Discover tests and when clicked (or the hotkey SHIFT-ALT-F9 is used) the list of TestSuite detail will be repopulated without any tests being executed. This comes in handy if you have a large number of tests and you just added a few that you want to run manually - simply refresh the list and select those new tests. If there are one or more tests selected, then when this button is clicked (or SHIFT-ALT-F9 is used) then the behavior changes to Run selected tests to only execute the tests that are checked in the treeview.
The next icon is the Debug test at the position of the code in the editor (ALT-F9) which was just demonstrated to me the other day by a colleague and is a great idea. This was useful to me by helping me debug a single unit test in a project with hundreds of tests. You simply navigate your cursor in the editor to the particular test you are interested in, likely set a breakpoint at the first line of code in the method and hit ALT-F9 and TestInsight will look up the current method your cursor is in and run that single test. This is also very useful when developing new tests in a large test project. This allows you to write a little code and occasionally hit ALT-F9 to gauge your success on that brand new test you are adding, or perhaps on a test you are editing. The ALT-F9 command also works while in the interface section. Simply select the line of a qualifying test method and hit ALT-F9 to run that single test. It simply cannot get much easier!
After the three Run icons there is a square icon used to Terminate the currently running test process and is useful if you want to restart a slow executing test suite.
The next icon is a red X and is used to simply Clear results by clearing the TestInsight Explorer window.
The following three icons are used as toggles for common filters. The yellow triangle icon Shows tests that reported a warning in the last run. The green check icon Shows tests that passed in the last run. The blue information icon Shows tests that were skipped in the previous test run. The filters are immediately applied and the test treeview is redrawn. I typically filter out all test results except those that failed to help draw my attention to that subset of tests.
The next icon is a clipboard and it also has a drop-down menu. The clipboard option is another simple toggle which redraws the treeview sorting the results by Type or Fixture. I typically sort my results by Fixture so I can easily check/uncheck groups of tests more easily. You can sort by Type to see the failed tests listed first.
There is a blue circular arrow icon next and that is used to Show the progress of a running test project. You can have a circular progress icon on the status bar of the window or next to each test as it executes and the test results are displayed after the suite is executed or during the test execution (which might slightly slow down the process.) Most tests are so fast that you should not be able to see much of a difference when setting this toggle option. If interested, you can add a few Sleep() method calls in your tests to see this cool feature in action. (For those of you with really slow tests, you won’t need to make any changes.)
Next up is a gray funnel icon used to filter test results. Once toggled on, a search edit box is made available to act as an instant search filter. All tests including that text are displayed. Simply click the funnel icon again to disable the filter.
The next to last icon is a Clock which is a toggle that enables the action to Run tests continually when idle. This relies on the “Idle time in seconds before automatic tests start” setting, which defaults to 2 seconds. If this option is toggled on, and you have made changes to the source since the last test run, and there has been no activity detected within the configured amount of time, then the tests are automatically executed and the TestInsight Explorer window updated. You simply concentrate on coding and let TestInsight handle the running of the tests for you in the background.
The last icon is a Disk used for the toggle to Run tests when the project is saved. This will hook into the IDE to monitor file save operations (on units and projects) and automatically trigger TestInsight when a save is detected. If you are in the habit of saving your work continuously throughout the day, then you can simply enable this option to have your test executed every time you save. For those that do not do much testing today, this can be an effective way to integrate unit testing into your current habits.
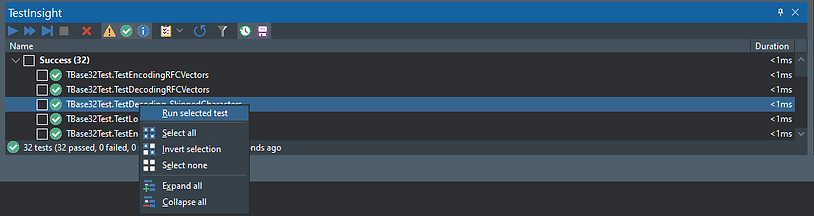
The test result treeview also has some special features. You can right click the test results to bring up a menu useful to run the currently selected test or can be used to manage the current selection with options to: Select all, Invert selection, Select none, Expand all, and Collapse all as seen below.
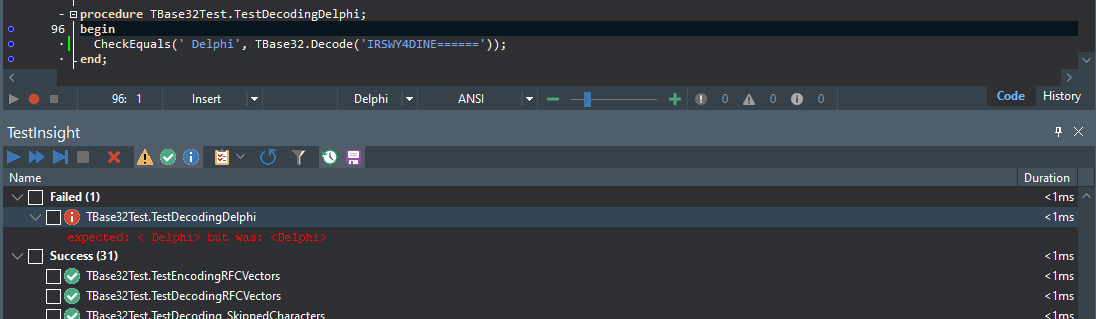
For each listed test, you can double-click the entry and TestInsight will navigate your mouse cursor to the implementation of that test method in the source. This is definitely a time saver and it is really useful when seeing a failure in the TestInsight Explorer window as shown below. Simply double-click the failed test and you be navigated to that particular test in your editor. A nice hidden feature is that you can copy a line from the treeview by simply selecting the line and using CTRL-C to copy (this is very useful for copying the error messages displayed.)
Another hidden feature is when your TestInsight testsuite is executing and you build your project manually - you will be presented with the prompt “Test is still running! Do you want to stop it?” with a Yes, No, and Cancel option. By cancelling the long running testsuite, your build process should complete without running to the F2039 Error “Could not create output file”
Support TestInsight!
As you can probably see by now, the free TestInsight tool from Stefan Glienke is pretty awesome. It has a nice set of features that help to supercharge your UnitTesting inside the RAD Studio IDE. If you use the product, you should help support ongoing development by telling everyone you know how cool it is and, if you can afford it, by donating to the project. There is a Donation button on the TestInsight wiki page that allows you to take a minute or two and securely donate a little money via PayPal to show your support of this valuable tool. I just donated €65 today and I challenge those of you that use this tool to donate at least €5 today to show some support. I have released some software in the past and I have asked for donations and I know how it usually ends up… it could be used by 50,000 different people and 2 or 3 people will donate a few bucks each. I do not wish to speak for Stefan, but I would wager that he did not release TestInsight to make a bunch of money off of it. However, how about we at least buy him a pizza or two for the amazing effort?
For More Info On TestInsight
Back in 2015, Stefan and Jim McKeeth teamed up on a Skill Sprint on Test Insight and there is a YouTube video of their discussion available for viewing here. A very early release version of TestInsight can be seen in a sneak preview video from Stefan on YouTube.
There is a blog post by Stefan regarding the TestInsight 1.2 release with a contribution from Wagner Landgraf. Here is a link to the original blog post announcing the release of TestInsight back in 2015.
Here is a really nice article from David Millington that covers Unit Testing and Test-Driven Development with TestInsight. If you are new to unit testing, this would be a great article to read next.
Finally, the Delphi-PRAXiS forums is a good knowledge base for TestInsight and Delphi in general. Join the conversation online at: https://en.delphipraxis.net/
Next Steps
Building a solid foundation is important for successful projects. All too often a great Delphi project has minimal, or no code support at all. It is too easy to quickly build a cool project in Delphi and simply disregard code quality and the true cost of maintenance over time. There are many Delphi projects out there with no unit tests, no code coverage reports, no static code analysis reports or even memory leak tests. (I know as I wrote a number of them myself!) Today there are still viable tooling solutions available for Delphi and we will cover more of these in this series on RADAuthenticator, making sure we have some sort of code-quality ecosystem in place to support the project.
The related code is released as Open Source under the Apache-2.0 license and is found within the rad-authenticator repository under my RADProgrammer organization on GitHub.
I have setup a RADProgrammer chat space on Discord dedicated to RADProgrammer projects such as this. Here is an invitation link to join this Discord. If you have something you want covered in this RADAuthenticator series just let me know.